Navigating Whiz Connect
Whiz Connect allows customers to easily track their usage and performance metrics over time through descriptive visualizations.
Highlighted metrics include run times and distances, coverage square footage, routes completed, and the number of and reasons for assists.
Use Whiz Connect to:
- Manage your fleet of robots with custom labeling for each Whiz
- Measure coverage in square feet and compare against targets
- Track how frequently the space is being cleaned
- Determine how to increase clean consistency & frequency
Overview
Intended to briefly summarize key statistics, the Overview page contains several graphs detailing usage (Actual Usage vs Target Usage), assists (Assists vs Usage), and route run information (Route Runs).
The ‘Overview’ page is best used for:
- Tracking usage against target usage over time (daily, weekly, and custom time periods), comparing times spent running autonomously versus training
- Monitoring daily assists for the current week
- Monitoring the number of the daily route runs for the current week
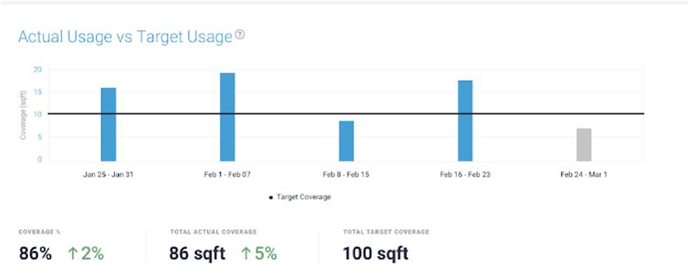
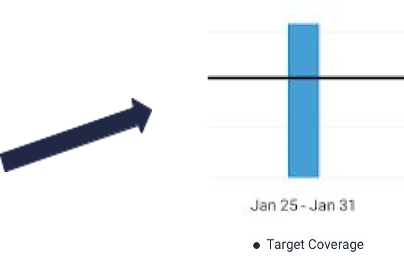
GRAPH: Actual Usage vs Target Usage
|
Target usage, or the target coverage in square feet, is calculated considering the total addressable square footage and represents the square feet Whiz is targeted to clean. For more specific information pertaining to usage, please see Usage. |
|
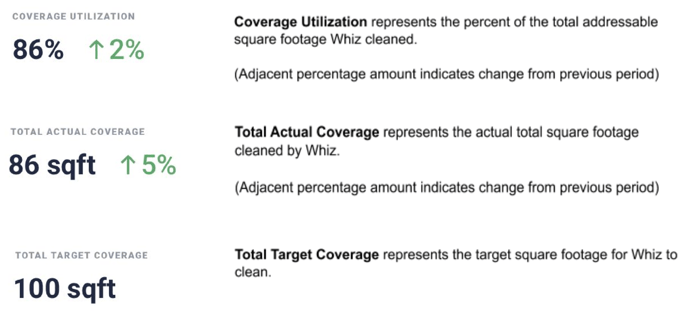
A number of metrics are called out below the graph, including Coverage Utilization, Total Actual Coverage, and Total Target Coverage.
Note: If you would like usage to be measured in total runtime, rather than coverage, toggle to ‘Runtime’ at the top of the page.
GRAPH: Assists vs Usage
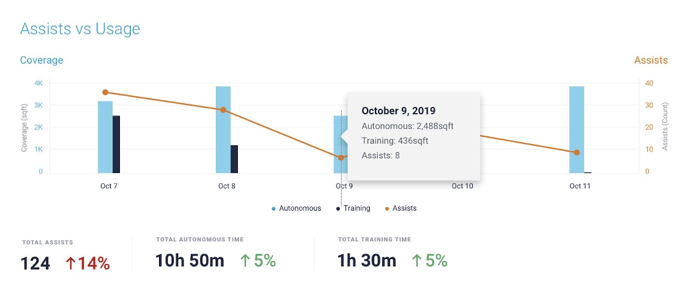 Assists and usage (coverage) may not correlate, though excessive or unresolved assists may prohibit Whiz from meeting usage targets.In the graph above, note that on October 11, the number of assists was the lowest (<10) and coverage was the greatest (nearly 4,000 sq/ft).
For more specific information pertaining to assists, such as their reasons, see Assists.
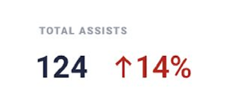
The total number of assists for the entire week is specified below the graph, with the percentage change from the last period adjacent.
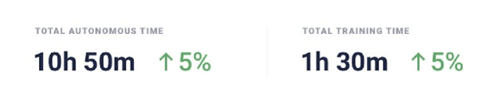
This graph differentiates between time Whiz spent in training mode, or being mapped by staff, and running autonomously.

The exact totals for the selected time period are listed below the graph, along with the percentage changes from the last period.
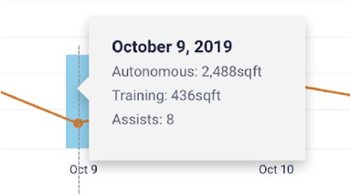
For more specific data pertaining to an individual day, hover over the day to trigger a pop-up containing both the autonomous and training coverage in square feet and the number of assists for that day.
GRAPH: Route Runs
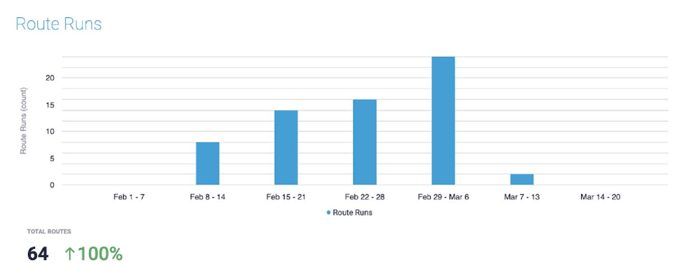
The Route Runs graph details the number of route runs on every day of the current week. It also lists the total number of runs for the entire week, with the percentage increase from the last period adjacent.
Hover over the individual day for the specific number of route runs for that day.
For more specific information pertaining to routes, please see Routes.
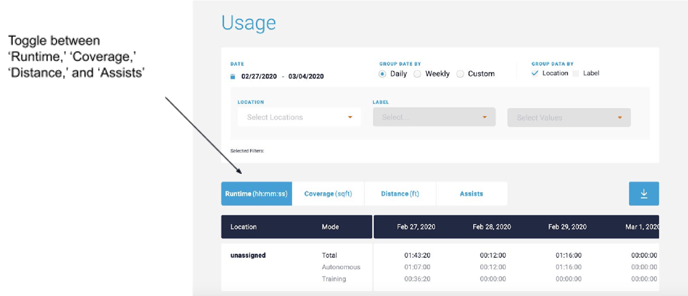
Usage
The Usage page displays various information pertaining to Whiz usage, including total run times, coverage in square feet, distance run, and the number of assists for each day.
 The Usage page is best used for:
- Gathering usage data for a prior week or custom date range.
- Comparing usage data between locations, robots, or other custom labels
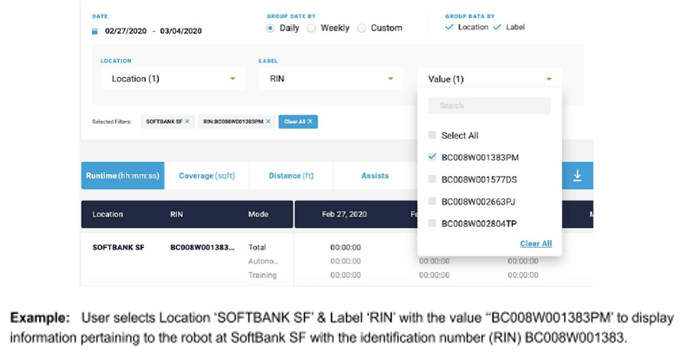
Users can filter this information to derive insights specific to date ranges, locations, robots, or any other custom category the customer has determined useful, indicated by labels, used to group and sort robots.
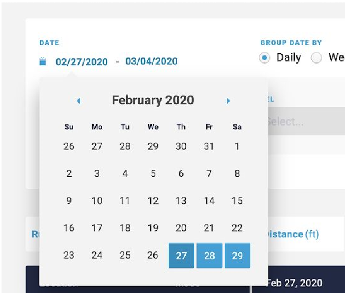
- Choose the start and end dates to display information for that range.
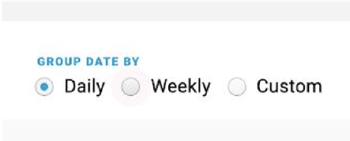
- Select the respective option from the ‘Group Date By’ menu: Daily, Weekly, or Custom to group the data by day, week, or custom date range.
- Select the respective option from the men to group data by location and/or a custom value.
Assists
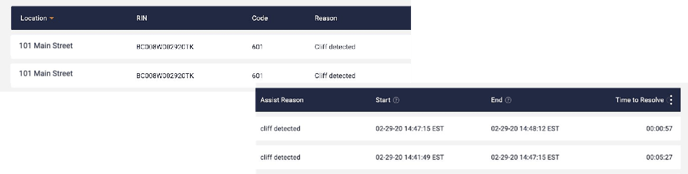
The Assists page is used to aggregate detailed information pertaining to assists, including the reasons for assists and their duration, and the amount of time it took before the issue causing the assist was resolved.
Customers can use the Assists page to:
- Better understand why Whiz is slowing down or prohibiting them from hitting their usage targets.
- Determine the locations where Whiz runs most efficiently, and conversely, where more detailed attention should be directed
Low assists counts indicate Whiz is running efficiently, encountering few obstacles along the route.
High assists counts can indicate an outdated or poor route map that failed to account for a number of obstacles, which are now triggering assists.
For more careful examination, a number of dropdown menus enable filtering for locations, assist reasons, duration of assists, or any label assigned to a robot.
See ‘Routes’ to view the assist reasons by route.
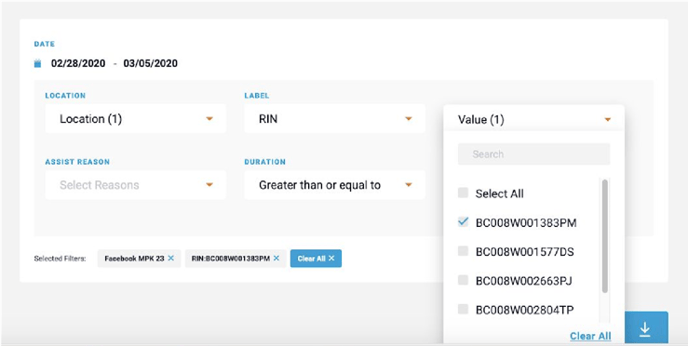
Selected data will automatically update the selection menu according to the filters selected by the user.
Routes
The ‘Routes’ page is used to aggregate more detailed information pertaining to routes, including route maps, the number of route runs, the total run time, and the time spent learning the route (training) and waiting for assists to be resolved.
Route map reporting enables customers to confirm cleaning was completed as predicted.
Every route card displays the last run route map, the RIN for the robot that ran the route, the address and time at which the route was run, for how long the route ran, and the assist counts/reason.
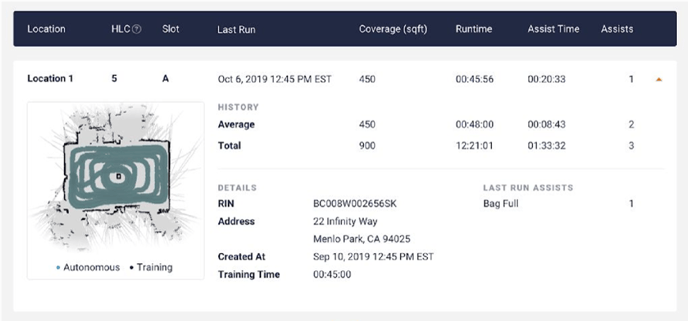
The ‘Routes’ page is the best way to analyze assists per route. On every route card, you can view the number of and reasons for each assist on the route.
If you want to see all routes beyond the last run routes for a period of time, you can download the report by clicking the download button at the top right corner.
Robots
Manage your Whiz fleet efficiently using the ‘Robots’ page on Whiz Connect.
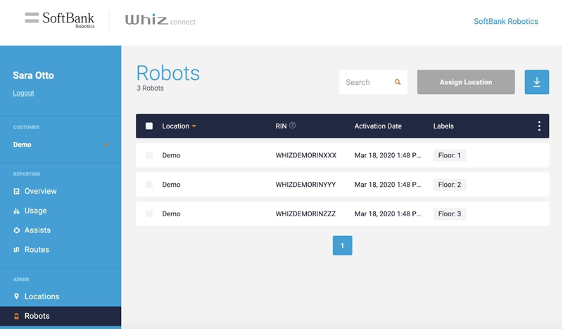
Every robot initialized for your organization is listed here.
To group and sort through robots more easily, utilize labels.
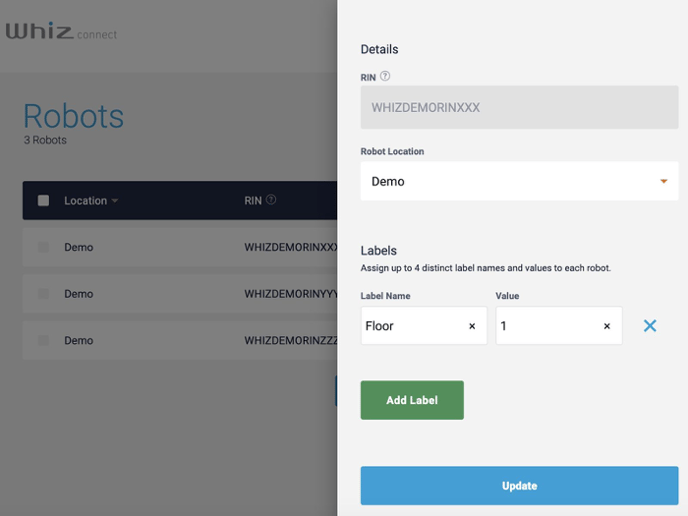
The ‘Robots’ page is the best tool to organize your robots and assign them labels.
On the other pages, you can group data by label, so it is important that you utilize the ‘Robots’ page to assign labels.